- Methodologies: inefficient to just muddle around
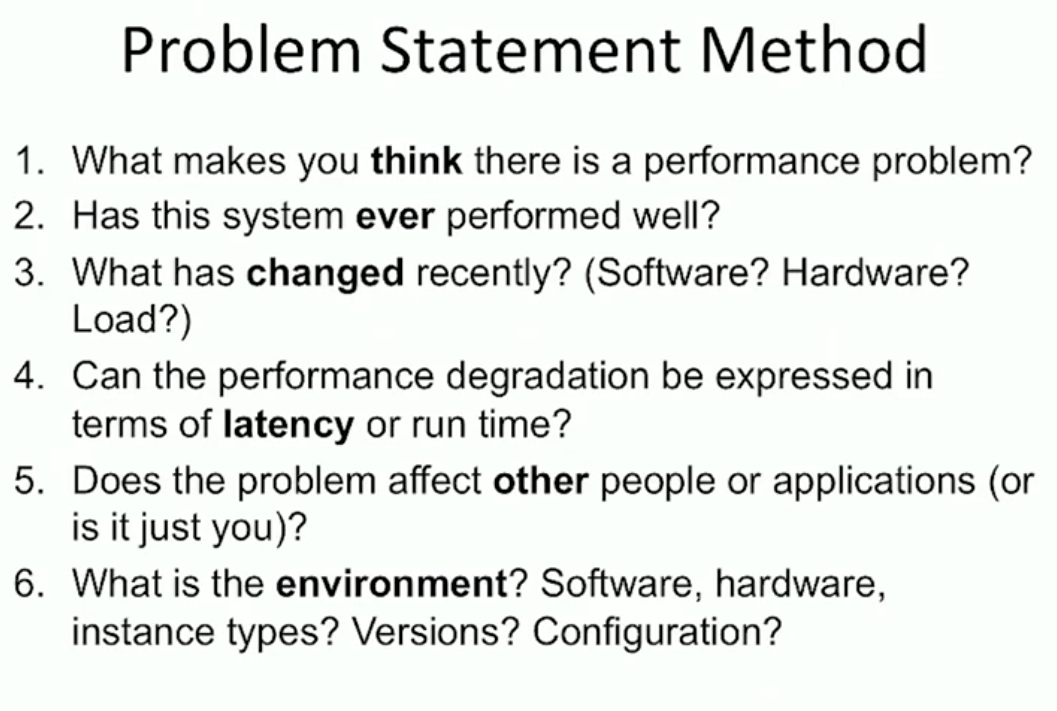
- Problem statement:
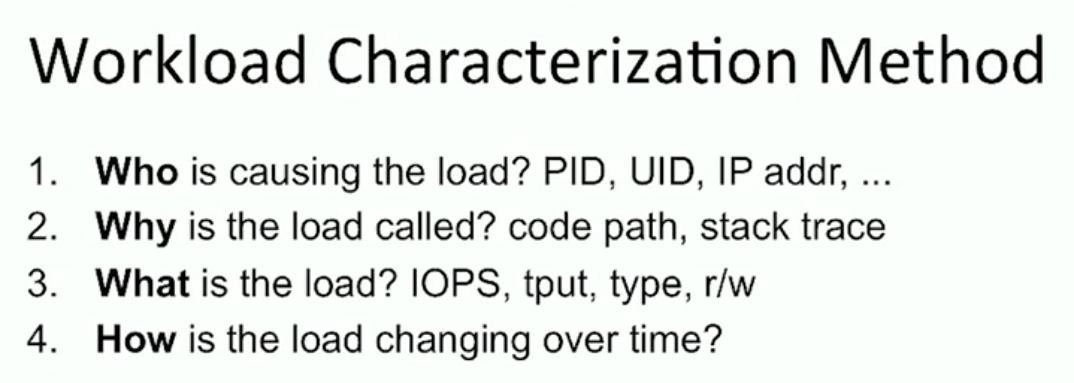
- Workload characterization:
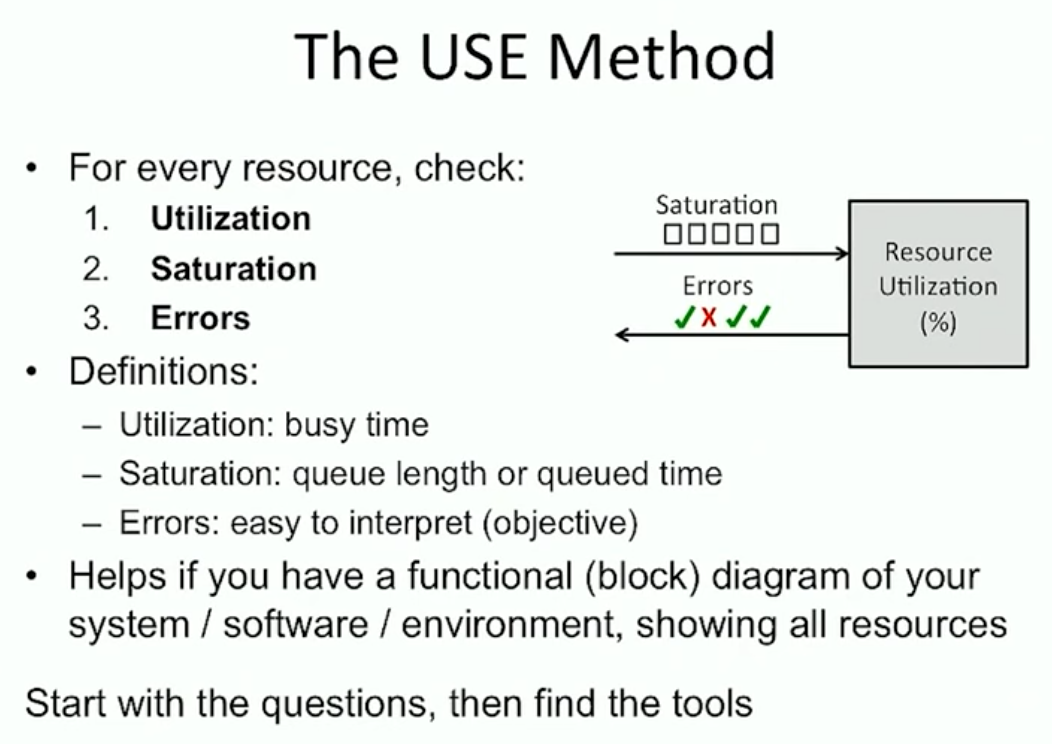
- USE method:
- Off-CPU analysis:
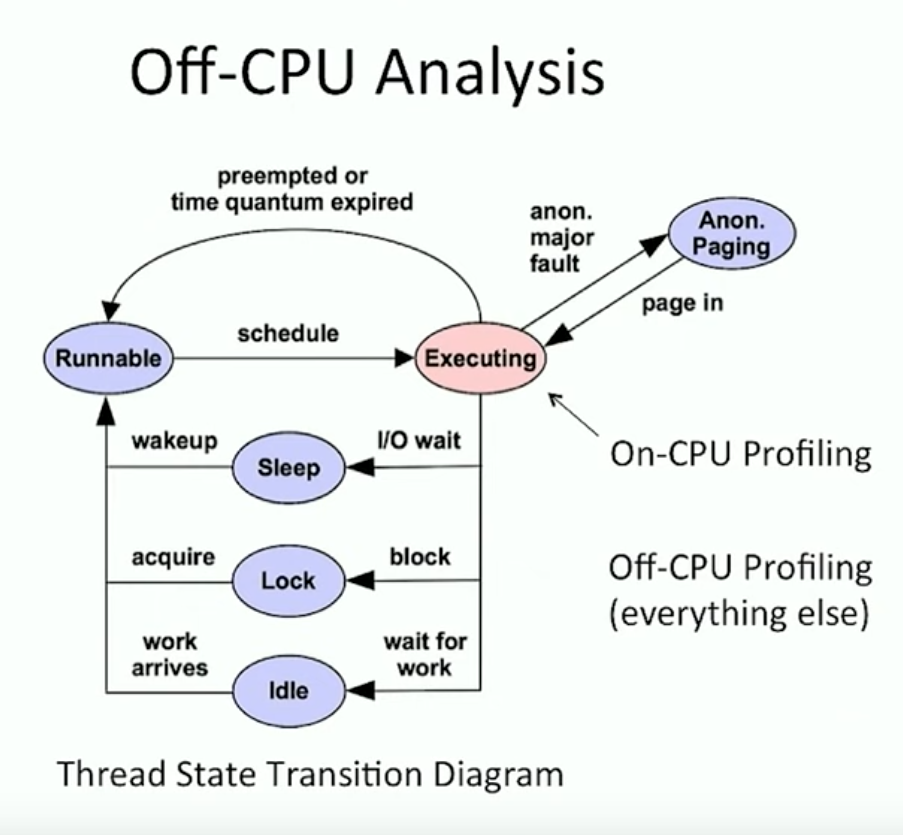
- Record when a process steps off the CPU
- CPU profile:

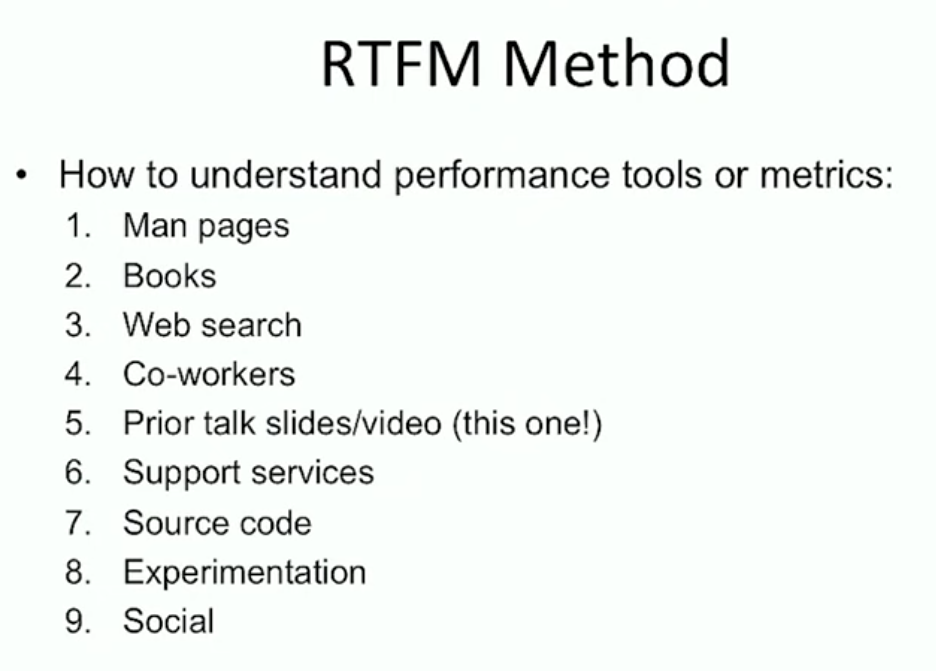
- RTFM:
- Linux load averages incorporate disk/etc. load, not just CPU
- htop samples, so spikes that start and end within the refresh interval are missed entirely (atop solves this)
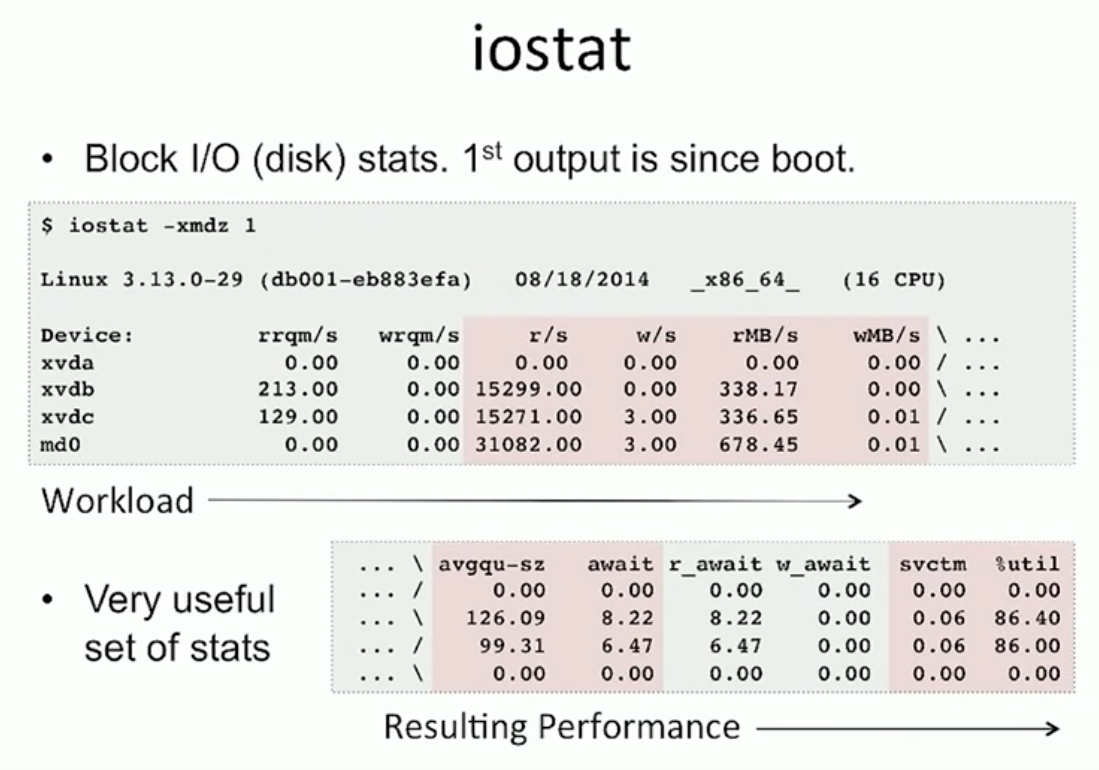
- iostat to gauge the workload and resulting perf:
- PMC: performance monitoring counters (hardware)
- ip route get
- Observability tools
- Intermediate tools
- strace (-ttt, -T)
- tcpdump
- Doesn’t scale well when you’re pushing a lot through a high-speed interface
- netstat (-i, -r, -p, -c, -s)
- nicstat
- pidstat (-t)
- swapon -s
- lsof
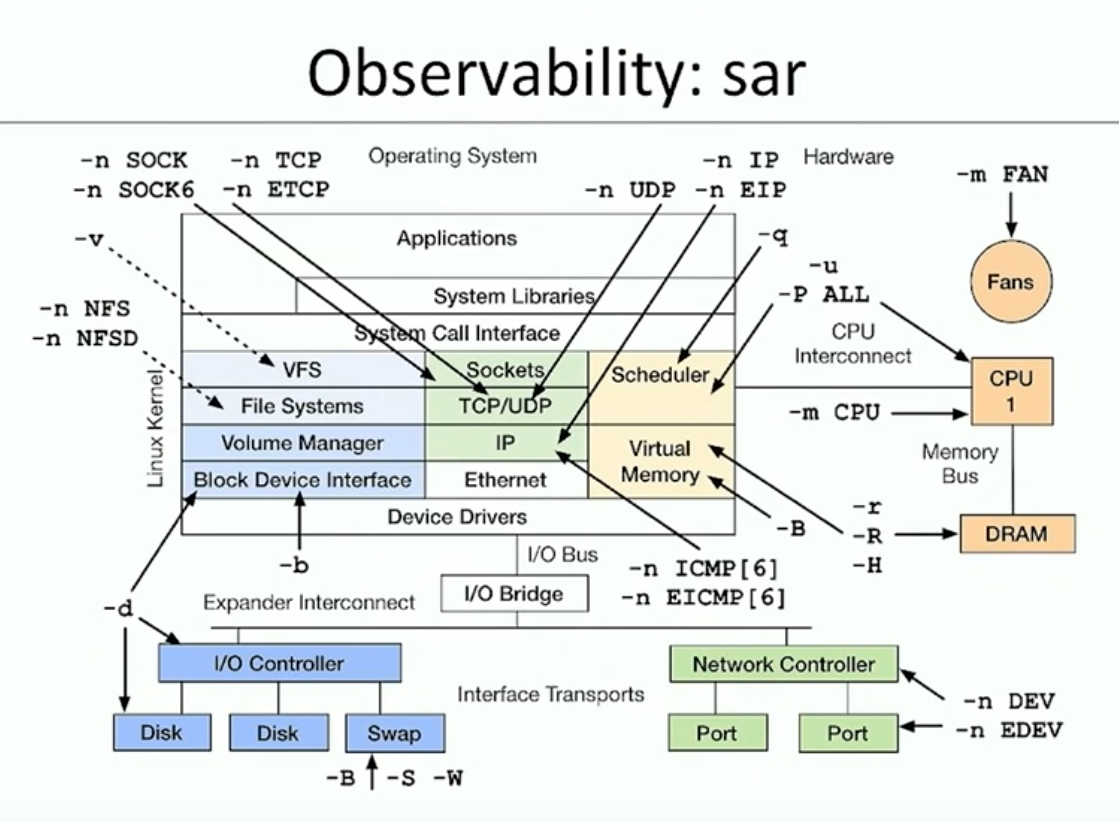
- sar (TCP, ETCP, DEV, EDEV)
- Advanced tools
- ss (-mop)
- iptraf (histogram of packet sizes)
- iotop
- slabtop
- pcstat (page cache usage by file)
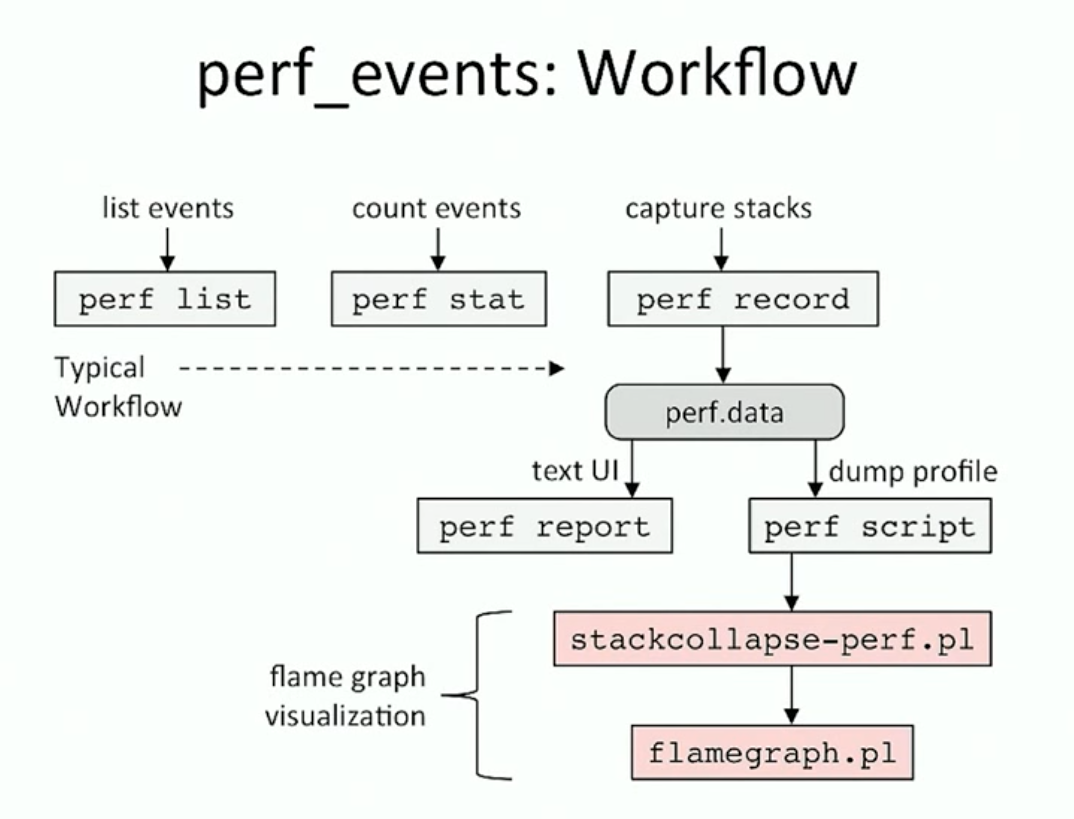
- perf_events (perf, perf top, perf stat - part of the kernel)
- rdmsr (MSRs - model specific registers - enabled in Xen unlike PMCs)
- ltrace
- ethtool
- snmpget
- blktrace
- pmu-tools
- Benchmarking tools
- perf bench
- lmbench
- fio
- pchar
- iperf, hping3
- ttcp
- Profiling tools
- perf record (don’t pick 100Hz to avoid sampling in lockstep)
- execsnoop
-
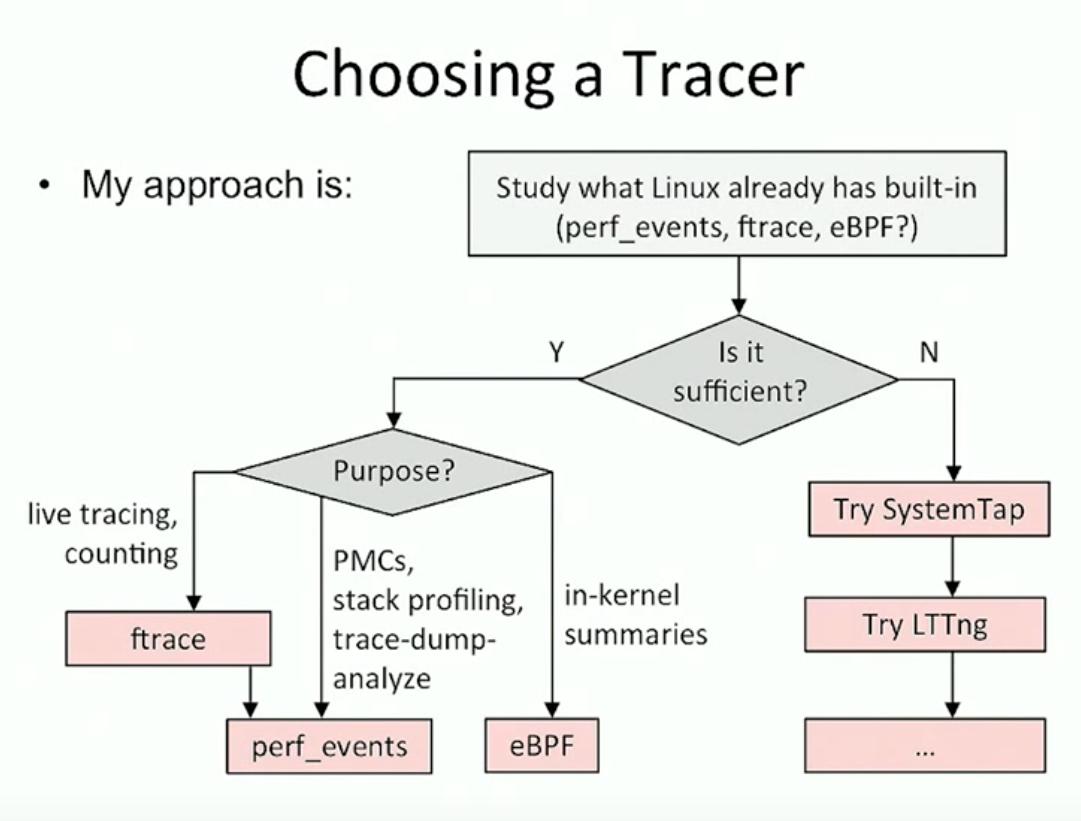
- Tracing tools